Checklist for consideration

digital-citizenship
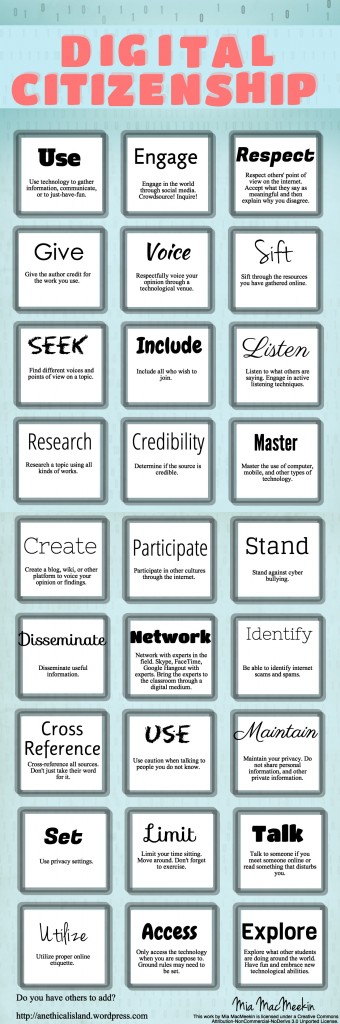
As I read through the items on this wonderful Infographic from Mia, I kept thinking that the title might be broadened.   I love the ideas, the thoughts expressed but I believe it applies to all our lives.  I have often heard and agreed that ‘Digital Citizenship’ is unnecessary as in fact is really just part of Citizenship in general.

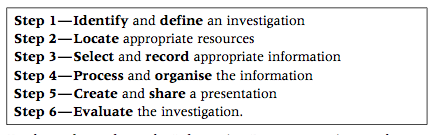
In fact, this list could also just as easily apply to our use of technology tools in schools. Many schools have embarked on 1:1 programs with anywhere, anytime access to technology.  I wonder if it would help teachers and students to apply this list as a filter when determining the value of these programs.   It could also help us plan for opportunities to maximise the value of the equipment – see it as a checklist perhaps? 

Are we using technology at appropriate times? Are students able to make these choices?

Are we sifting through the tools, the resources and making good choices? Applying digital literacy skills?

Are we disseminating information or knowledge we create?

Are we taking the opportunity to create a forum for our own voice as well as those others?

Are we gaining perspectives by using technology to listen to other points of view?

Are we using technology to truly participate in a learning community in a two way manner or just consuming what is found there?

Do we limit the use to times when technology actually performs a task that is better?   Considering the SAMR  model, do we use tech for substitution purposes and not take advantage of the transformational potential?

I think it is a powerful list, definitely useful for citizenship but can be applied elsewhere as well.   

What do you think ?

Infographics

Information graphics or infographics are graphic visual representations of informationdata or knowledge intended to present complex information quickly and clearly. *

Another idea I have gained from a Teachmeet was having students create Infographics  to present their learning.  (Thanks Karis @karisd84). I see Infographics as an extension or adaptation of a few older styles of presentation modes such as posters and Powerpoints., however there is a big point of difference, the thinking required in order to develop an Infographic is quite complex. To break information down in to small packets and to represent it in a succinct and visual manner, requires a large degree of understanding and comprehension as well as creative flair.  This is not a simple task for most students.

Elements of the Information process are explored when processing the information required to make an Infographic.   This screenshot  taken from WA First Steps, list the process.     This week, we will suggest that our students consider creating Infographics as a presentation tool.  It will be interesting to see who choses to give it a go and how they  go.

Screen Shot 2013-08-18 at 6.14.29 PM

In my research about Infographics, I found the following resources which I will use to introduce the idea to students:

Create your own Playlist on MentorMob!
* http://en.wikipedia.org/wiki/Infographic Quoting Doug Newsom and Jim Haynes (2004). Public Relations Writing: Form and Style. p.236