Information graphics or infographics are graphic visual representations of information, data or knowledge intended to present complex information quickly and clearly. *
Another idea I have gained from a Teachmeet was having students create Infographics to present their learning. (Thanks Karis @karisd84). I see Infographics as an extension or adaptation of a few older styles of presentation modes such as posters and Powerpoints., however there is a big point of difference, the thinking required in order to develop an Infographic is quite complex. To break information down in to small packets and to represent it in a succinct and visual manner, requires a large degree of understanding and comprehension as well as creative flair. This is not a simple task for most students.
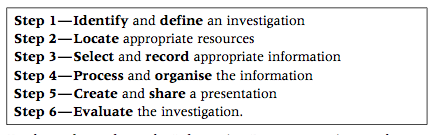
Elements of the Information process are explored when processing the information required to make an Infographic. This screenshot taken from WA First Steps, list the process. This week, we will suggest that our students consider creating Infographics as a presentation tool. It will be interesting to see who choses to give it a go and how they go.
In my research about Infographics, I found the following resources which I will use to introduce the idea to students: